Easy Swing Indicator
Three signals. One chart. Less guessing.
Easy Swing does not guess the exact low or high. It shows where the panic is, where the wave tops out, and where selling fades.
What is Easy Swing?
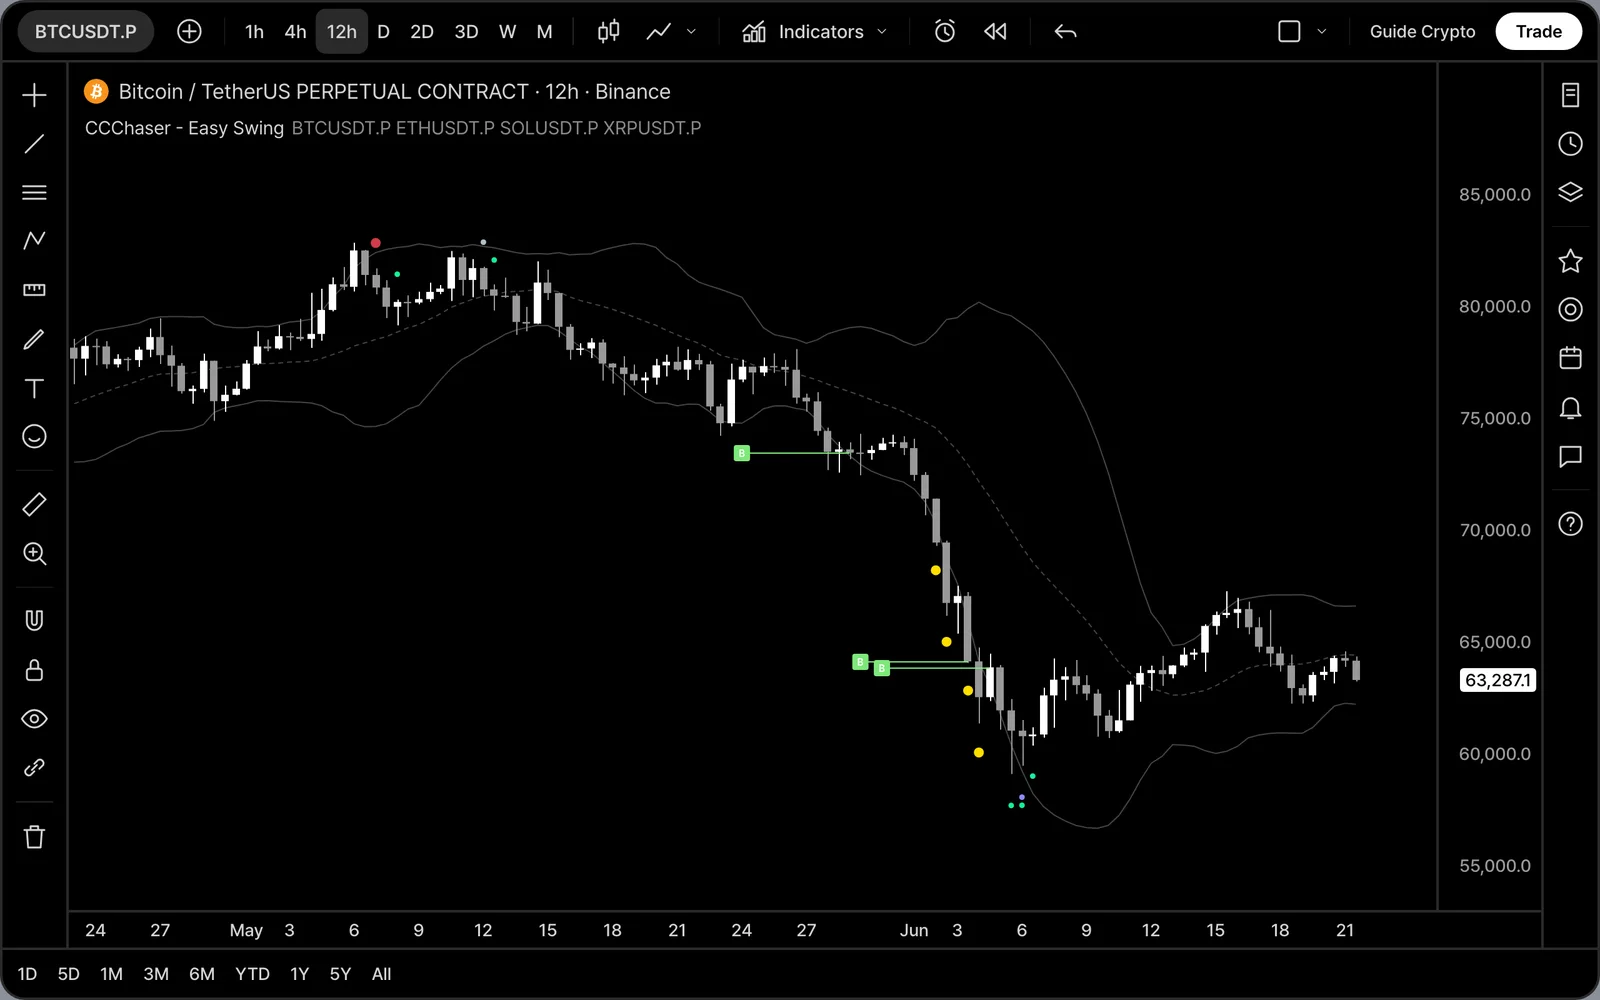
Easy Swing is one TradingView indicator with three signals. A yellow dot under the candle is Sold Out. A red dot above the candle is Pulse Peak. A green line with B is Momentum Buy. Every signal is confirmed when the candle closes.
Sold Out: when everyone panics
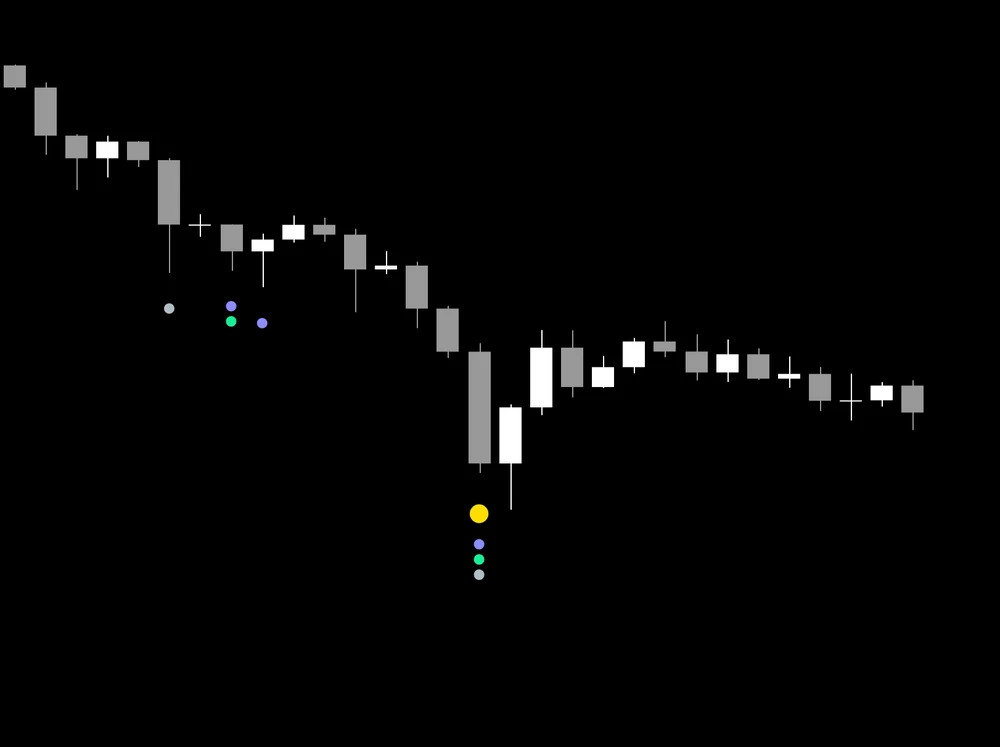
Imagine everyone rushing out of a store at once. Once they are gone, few sellers are left. Sold Out shows up when selling turns into real panic. It is rare by design and tends to appear near deep, emotional lows.
Treat it as a zone to start buying slowly, not as proof that the bottom is in. The extra colored dots under the same candle are other coins that hit Sold Out at the same time.
Pulse Peak: when the wave hits the top
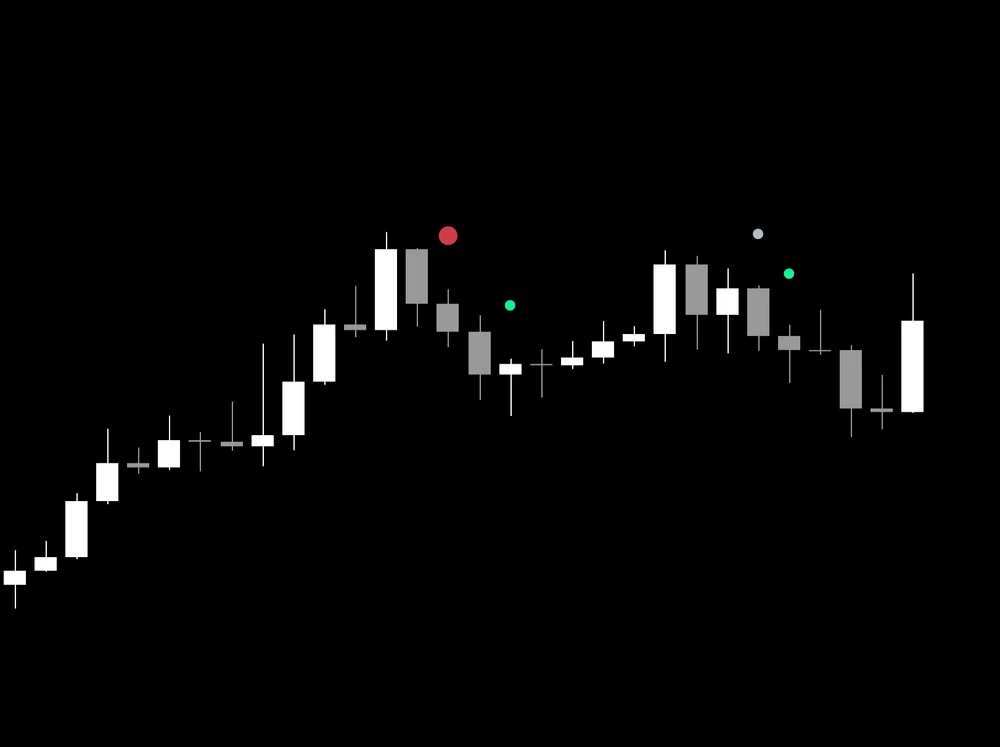
Price moves in waves. When a wave gets overheated and then starts to cool down, Pulse Peak puts a red dot above the candle. It is a good zone to take some profit, step by step. In a strong uptrend more than one red dot can show up, so you do not have to sell everything at the first one.
Momentum Buy: when selling slows down
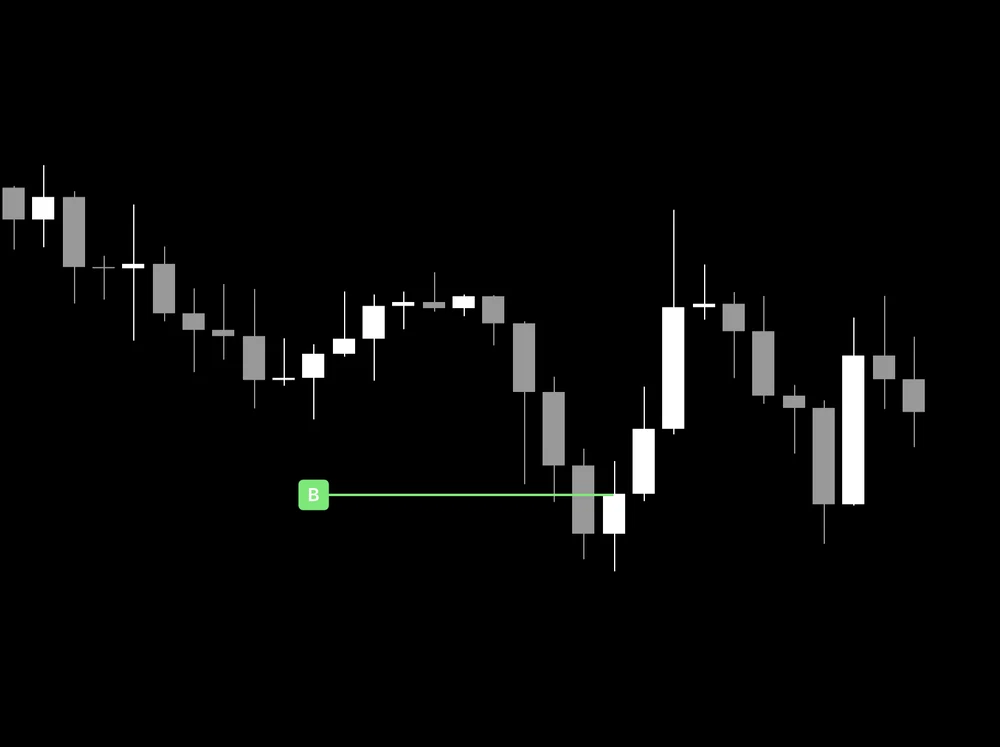
After a deep sell-off, the red candles start to get smaller. Momentum Buy draws a green line with B when the selling starts losing power. It fires only once per slowdown, so you do not see the same signal again and again. If the drop keeps going, another B can appear lower.
Cheat sheet
| Signal | Looks like | Use it to |
|---|---|---|
| Sold Out | Yellow dot below the candle | Start buying slowly in a panic |
| Pulse Peak | Red dot above the candle | Take some profit |
| Momentum Buy | Green line with B | Buy as selling fades |
Watch four other coins on the same chart and get every signal with one alert.
Read the setup guide →